
Compressor Mapper 1.0 [Software Review]
Software Overview
Compressor Mapper (developed by Torquecode) is a simple but effective utility software that converts scanned centrifugal compressor head and efficiency map images into a digitized set of compressor map data points useful for simulation purposes.
This is especially useful in situations when a compressor map is provided only in hard copy. The tool translates the hard copy map into data points of the head, flow, and efficiency which can serve as input to simulation software. This is done via a scanned electronic copy.
This article highlights Eta Energy Solutions’ key findings and opinions following an independent review of the software.
Compressor Mapper Pros
Has good and powerful functionality that enables you to get the job (digitizing compressor maps) done as well as customize its outputs.
Compressor Mapper Cons
The software can be a bit inflexible in the digitization of efficiency maps. User experience can also be improved.
Software Overall Rating
A simple but powerful and effective tool that does what it says on the tin. I am sure subsequent versions will significantly improve the user experience.
OVERALL RATING: 6/10
Software Review
USER-FRIENDLINESS
The software utility downloads from the online link quite easily, quickly, and professionally. However, the software publisher details were not included or adequate on the installation file and this brought unnecessary warnings from my pc.
There was a “Load” button at the top menu (See Figure 1 below) and it was initially unclear to me what this was for. I subsequently found out that this was not for loading scanned images but for loading existing files of the software. The software enables you to save and subsequently load files you had worked on. I am not sure how useful this particular feature would be to users since there is already an “Export as CSV” button to export generated data points in excel/CSV format.
One drawback of the “Export to CSV” button is that it is hidden behind the save button in a drop-down button menu. As a result, it is not immediately clear what to do next after generating all the numeric data points. In my opinion, the “Export to CSV” button is quite an important one (arguably more so than the Save/Save as a button) and should therefore have prominence. It should be a standalone button or if it has to be combined with others in a drop-down, it should be the one at the top.
The button for loading scanned compressor map images is called “Load Map Image” located at the bottom right of the user interface. It is a bit confusing to have this button as well as having the “Load” button I described above. More should be done to distinguish these two buttons which have very different functions. I would suggest that the “Load” button be renamed “Open”. This is in line with popular conventions used in Microsoft software products.
One impressive feature of the software is the ease with which the scanned map image can be easily resized to fit the required plot area. There are many handles to manipulate the map to fit the plot area including handles to zoom, stretch, skew, drag, and drop the compressor map image.
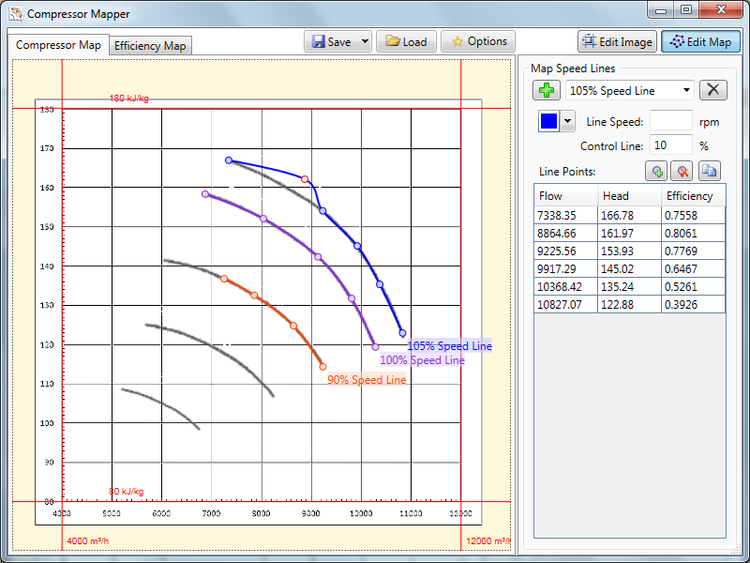
Once the scanned map has been fitted to the plot area, the speed lines and data points can then be selected and mapped, automatically generating the numerical data (one-speed line at a time). One feature which I found helpful was that when you click on any speed line on the display, the numerical data table automatically changed to reflect the speed line you had selected.
There are a few icon buttons above the generated data points which (from trying them out, I found) are used for adding or deleting data points. I recommend that these display text labels when one hovers over them in order to improve understanding of what the icon button does prior to clicking it. The software developers got this right with the “copy to clipboard” icon button which displays the required text when you hover over it with the cursor. The same principle should be applied to the other buttons that have only images.
In general, the tool is quite intuitive and easy to use once you get the hang of it.
RATING: 5/10
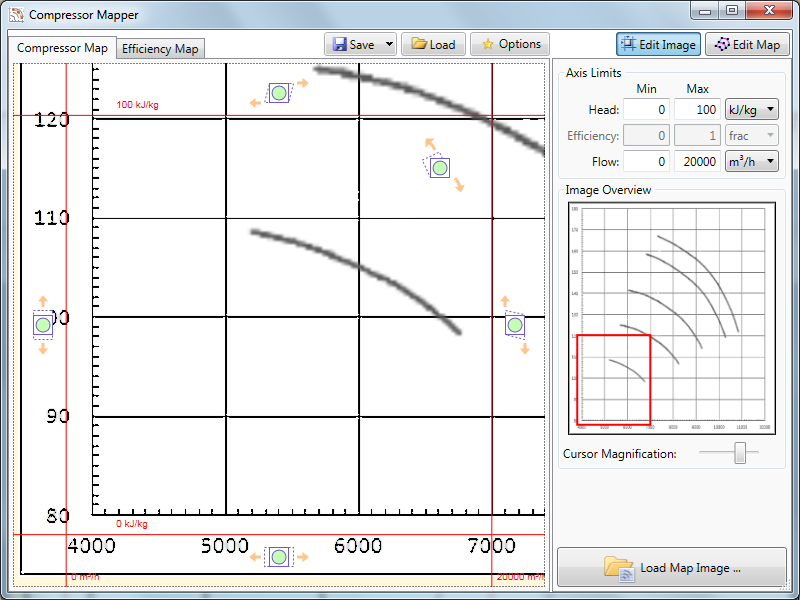
Figure 1
SOFTWARE FUNCTIONALITY
Although the software does not support images in pdf format, it does support a wide variety of acceptable image formats including jpg, png, and BMP.
The utility allows you to select the points which you would like digitized from each speed line/curve of the compressor map. When selecting the speed line points, the tool smartly gives you an indication of the trajectory of the curve you are likely to get based on the points you have selected. This is quite helpful as it enables you to adjust the position of the points you have selected or add more points to create a better and smoother match to the parent curve. The ability to add more data points is another fantastic feature of the tool.
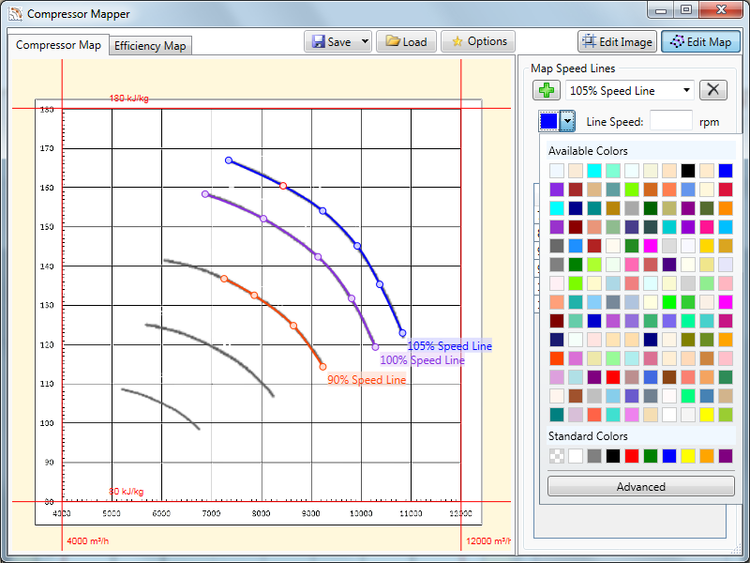
Another great feature of the software is that one is able to change the color of each of the speed lines to an appropriate choice from a very large selection of colors. This can be quite helpful for the purposes of distinguishing different speed lines as well as other aesthetic benefits.
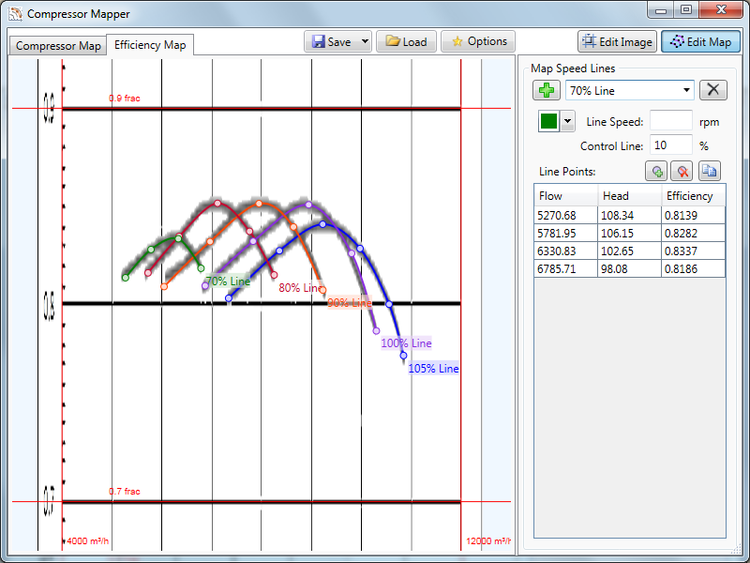
The main benefit of the tool is that in general, you get a more accurate reading of compressor maps compared to if it is done manually. The level of accuracy is very good in terms of mapping the compressor points and lines. This is achieved for both head and efficiency maps.
One major constraint with the tool however is that efficiency maps cannot be digitised independently. This needs to be preceded by the digitization of the equivalent head map. This is because the digitisation of the efficiency map utilises the same flow data generated from the head map. This results in the user having only one degree of freedom during the efficiency map digitisation i.e. to set the efficiency values. You are unable to adjust the values of flow during the efficiency map digitization process. Sometimes the number of data points suitably selected when digitizing the head maps may not be sufficient for that of the efficiency map. In such a case this constraint makes it such that you would need to go back to the head map interface to add the extra point required prior to returning to the efficiency map interface to complete the digitization process.
RATING: 7/10
GRAPHICAL USER INTERFACE
The software utility has a very neat and professional looking Graphical User Interface (GUI).
The table displaying the generated numerical points provides a field for entering Control Line %. The meaning of this is unclear but my presumption is that it means the margin between the surge limit and control lines. My observation is that any figure entered into this field seems to have no impact whatsoever on the data points generated. This in my opinion implies that this field is unnecessary.
RATING: 7/10
HELP AND SUPPORT
There was a quick response and resolution from the software support team for a query I had regarding the license key.
Whatever it is, the way you tell your story online can make all the difference.
At the time of the software review, the software manual link was empty and did not provide any link to the manual document. This meant I was initially slow in figuring out how certain things worked.
RATING: 5/10
Software Specifications
MINIMUM REQUIREMENTS
Operating System: Windows 7 (.NET framework version 4.0)
Processor: 1 GHz or faster 32-bit or 64-bit.
Memory: 1 GB RAM (32-bit) or 2 GB RAM (64-bit).
Disk Space: 3 MB available hard disk space.
NOTES
In addition to the minimum system requirements, an internet connection is required for the online product activation system. However, there is also an 'off-line' product activation that can be done via email (and a memory stick if not on the same machine).